
Announcing an update for Nimble Property’s happy users! We have revamped our Dashboard for a seamless navigation in to the hotel performance, operations and other crucial happenings, by leveraging enhanced metrics. The single-screen layout with side-by-side widgets switches focus on bringing more intuitive look. We’re here to give a brief walkthrough – Have a glance!
Distinct Widgets – For Better Visualization & Understanding.
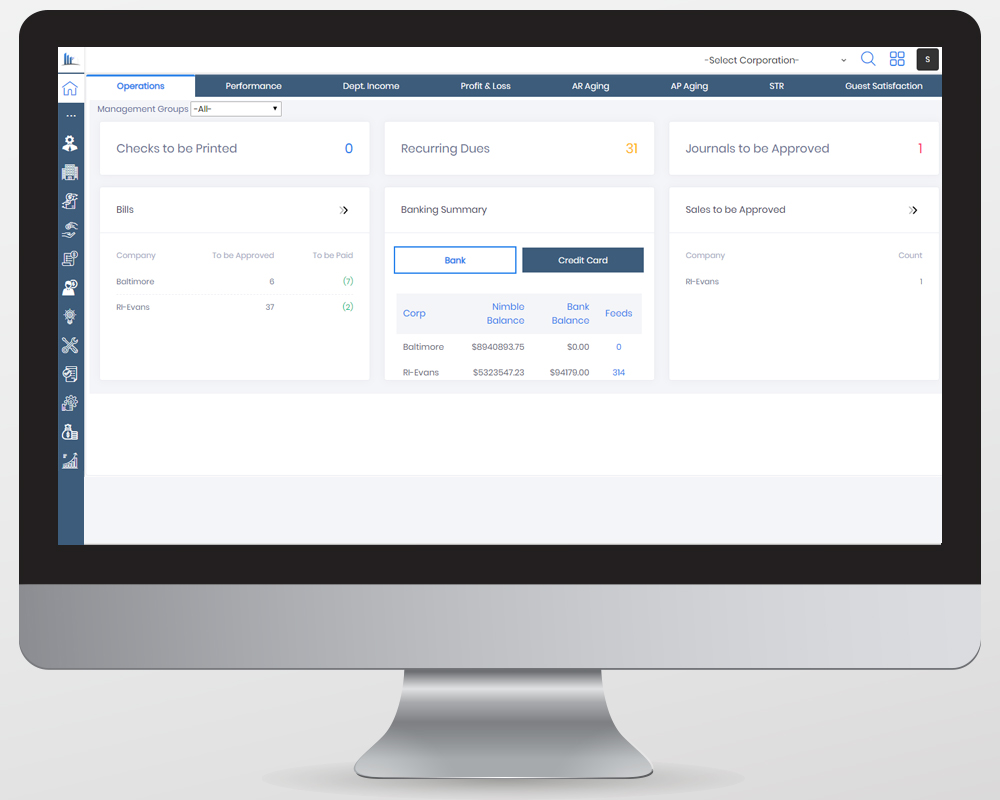
OPERATIONS
From an operational perspective, the widget on Nimble’s all new dashboard lets you monitor all operations – Including Checks to be Printed, Recurring Dues, Journals & Sales to be Approved, Bills to be Approved & Paid, along with Banking Summary of all your entire portfolio.
PERFORMANCE
The performance budget on Nimble Property’s improved dashboard lets you visualize all your portfolio’s KPIs – Including Occupancy%, Rooms Sold, ADR, RevPar, Room Revenue and Total Revenue – Everything on a single screen!
As a result, you can direct you hotel staff and improve your management groups.
DEPT.INCOME
For maximum effectiveness, the strategic dashboard lets you better visualize and analyze the departmental-wise income, revenue and expenses – Within the desired time period, allowing you to drill down into the statements.
PROFIT & LOSS
The latest dashboard keeps you aligned with your focused goals, allowing you to gain insights on the Profit & Loss details of your entire portfolio on a single screen.
Corporation-wise, the Income, Cost of Goods, Expenses and other Miscellaneous Expenses, along with the Net Profit is displayed and summarized.
AR AGING
The AR Aging widget on our enriched dashboard displays all your properties’ aging summary, so you can act on them proactively. Even you can drilldown the root causes and possible bottlenecks, by filtering through the transaction date.
AP AGING
Our enhanced dashboard outlines your Accounts Payable aging summary, which includes the dues you owe to your vendors. Stay on top of it to avoid any cashflow breakdowns and maintain good relationships with your vendors.
STR
Access all of your competitors performing areas and analyze where you stand in the competition. Drill down to gain insights on the competitive sets, financial statistics and key performing areas on the consolidated dashboard. Say goodbye to STR reports juggling!
GUEST SATISFACTION
The all new improved dashboard gives you a hawk eye view on your Guest Satisfaction (GSS) Info of all properties at one place.
Property-wise the key drivers, benchmarking information and comments are displayed. So you can get the pulse of your guests.
Conclusion
We’re confident that our new update (Revamped dashboard) will make it extremely easy and intuitive for you in managing your business to drive better financial performance, while unleashing more space to focus on the big picture.
